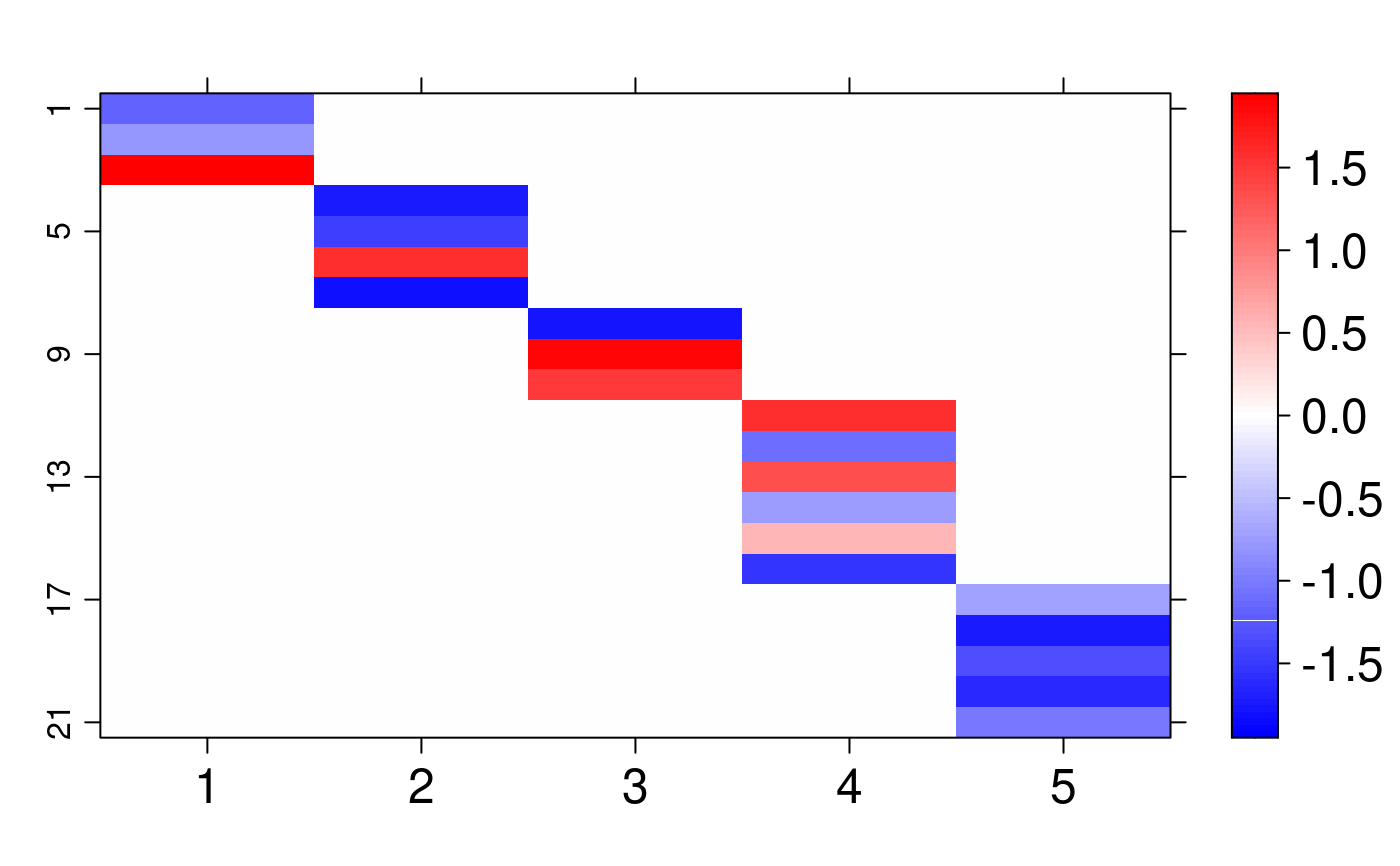
Graphical representation for matrix class objects using lattice package
arrayplot(
  y,
  mini = -max(abs(min(y)), max(y)),
  maxi = max(abs(min(y)), max(y)),
  colors = 1,
  ylab = "",
  xlab = "",
  main = ""
)
Arguments
| y | a numerical data.frame or matrix object |
|---|---|
| mini, | minimum color range (might cause blank spots if misspecified) |
| maxi, | maximum color range (might cause blank spots if misspecified) |
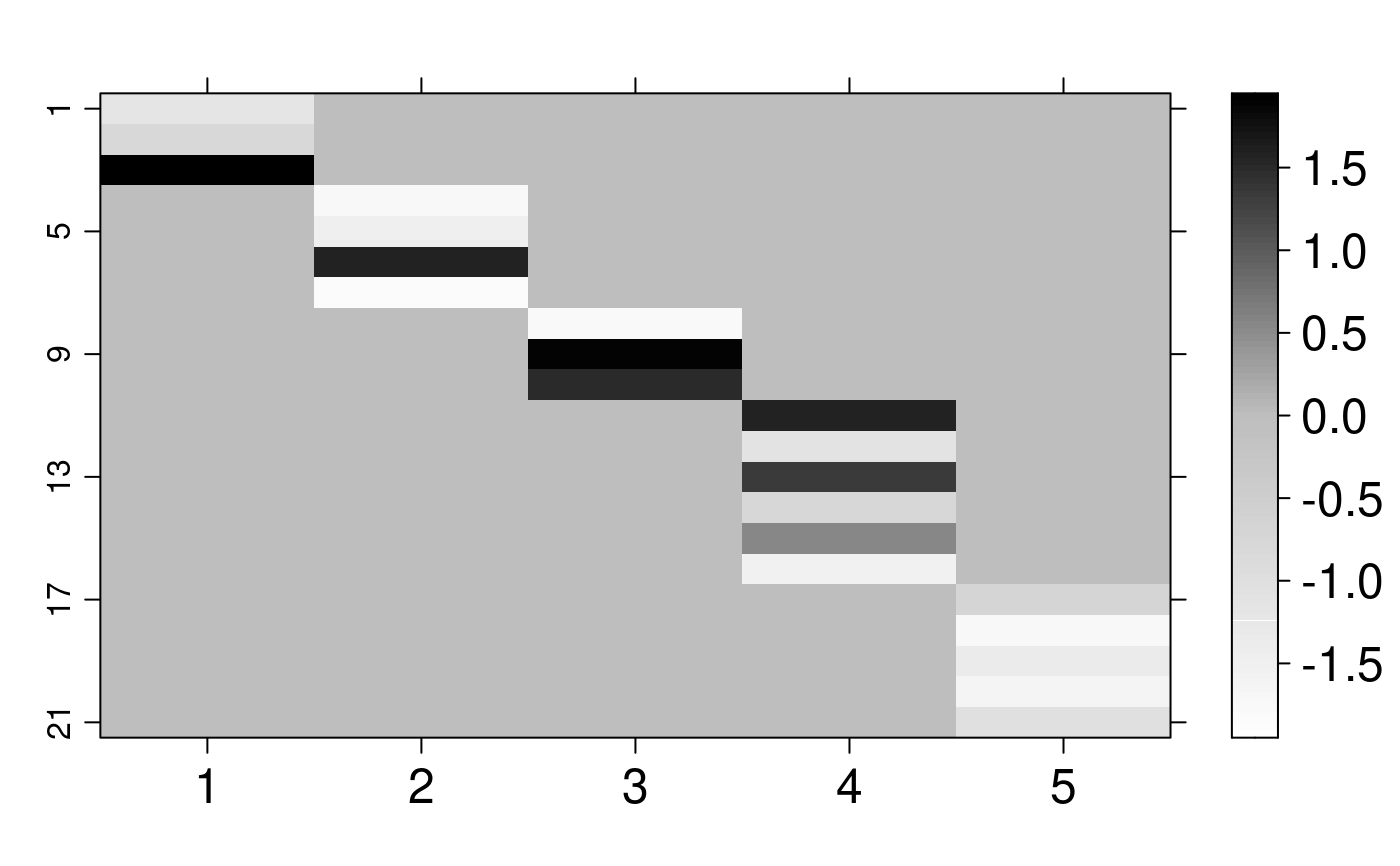
| colors | 1 = blue/red, 0 = white/black |
| ylab | y axis label passed to |
| xlab | x axis label passed to |
| main | plot title passed to |
See also
Examples
arrayplot(dt$real$alpha, colors = 0)