
This vignette is the short path to
cams(): estimands, assumptions, Bayesian
and REML inference on the same model, and the main summaries.
Contribution-adjusted meta-analysis (CAMS) is the treatment-by-subgroup
interaction model developed in Panaro et al. (2025). For additional shipped
datasets (age, edss, il6,
RESPIRE), see vignette("worked-examples").
For tables you can QC or hand to reporting, see vignette("export-and-qc").
Estimands (what CAMS reports)
| Estimand | Function | Depends on reporting IF? |
|---|---|---|
| Treatment-by-subgroup interaction | interactions() |
No |
| Modifier-level mean effects , | modifiers() |
Yes (default pooled ) |
| Combined-population mean | combined() |
Yes |
| Trial information fractions |
ifrac() (optional before fit) |
Built inside cams() by default |
The reference modifier (e.g. NIV vs IV) sets the
direction of
.
All fits are on the escalc scale (yi,
vi); use exponentiate = TRUE
for odds ratios, hazard ratios, or other ratio measures.
Scope and key assumptions
Intended use. CAMS synthesises aggregate subgroup effects across trials (published tables, systematic reviews, HTA-style evidence pools). It is not a substitute for a pre-specified subgroup analysis in a single randomised trial SAP.
Data. Long format: one row per trial × modifier with
yi and vi.
Use escalc() (re-exported from
metafor (Viechtbauer 2010)) when starting
from event counts.
Within-trial sampling. The implementation treats the
two modifier estimates in a trial as conditionally
independent with variances vi,
and uses precision-based information fractions
.
Shared control arms, nested subgroups, or other within-trial
dependence are not modelled yet (see
?cams, section on sampling
assumption).
Between-trial heterogeneity. Separate random-effects
components for the interaction contrasts and the combined-effect
meta-regression (Panaro et al. 2025); see
heterogeneity() after fit.
Example: COVID steroids (IV / NIV)
The steroids data are mortality
odds ratios by ventilation subgroup (IV vs NIV) from
the REACT meta-analysis (WHO Rapid Evidence
Appraisal for COVID-19 Therapies (REACT) Working Group et al.
2020). Rows with n = 0 mark
unreported subgroups; ifrac() completes
the table for CAMS (see vignette("worked-examples"),
il6 section).
One model, two inference backends
cams() specifies the same CAMS
likelihood; choose Bayesian (default,
bayesmeta (Röver 2020)) or
frequentist
(method = "REML", metafor
(Viechtbauer
2010)). Below we fit both on
des with
reference = "NIV". The half-normal scales
on
and
follow Panaro et al. (2026a) (not the package
defaults, which are improper uniform priors on heterogeneity).
fit_bayes <- cams(
  des,
  reference = "NIV",
  tau.prior = function(tau) bayesmeta::dhalfnormal(tau, scale = 0.5),
  tau.interaction.prior = function(tau) bayesmeta::dhalfnormal(tau, scale = 0.1)
)
fit_reml <- cams(des, reference = "NIV", method = "REML")
The interaction does not depend on the reporting
information fraction. Modifier and combined summaries
do; they use the pooled reporting
from ifrac(fit) by default.
ix_b <- tidy(interactions(fit_bayes, type = "Overall", exponentiate = TRUE))
ix_r <- tidy(interactions(fit_reml, type = "Overall", exponentiate = TRUE))
knitr::kable(
  bind_rows(Bayesian = ix_b, REML = ix_r, .id = "inference") |>
    select(inference, type, estimate, conf.low, conf.high),
  digits = 2,
  caption = "Interaction (OR scale): Bayesian credible vs REML confidence intervals"
)| inference | type | estimate | conf.low | conf.high |
|---|---|---|---|---|
| Bayesian | Overall | 1.35 | 0.32 | 2.38 |
| REML | Overall | 1.35 | 0.32 | 2.38 |
Bayesian and REML CAMS intervals are comparable. Bayesian credible
intervals use the DIRECT quadrature mixture (Röver and Friede 2017); they
reflect heterogeneity uncertainty and the priors above. REML intervals
are Wald confidence intervals from the stored
metafor fit (Viechtbauer 2010).
interactions(fit_reml, type = "Overall", exponentiate = TRUE)
#> interaction  type     estimate    se  Overall 95% CI
#> IV-NIV       Overall      1.35  0.52    (0.32, 2.38)
modifiers(fit_reml, type = "Overall", exponentiate = TRUE)
#> level  type     estimate    se  Overall 95% CI
#>    IV  Overall      1.47  0.47    (0.78, 2.77)
#>   NIV  Overall      0.38  0.15    (0.18, 0.82)
combined(fit_reml, type = "Overall", exponentiate = TRUE)
#> combined  estimate    se  Overall 95% CI
#>      All     -0.16  0.79   (-1.72, 1.39)
ifrac(fit_reml, ifrac = "interaction")
#>                   IF  estimate
#> interaction-weighted      0.59
#> (at fitted interaction heterogeneity τ_γ)
Forest plot (reporting checklist)
forestplot() draws observed modifier
estimates, optional shrinkage, and Overall /
Prediction summaries at
.
For publication-style figures, set
exponentiate = TRUE,
favours text, and keep table numbers from
tidy(modifiers(...)) aligned with the
pooled diamonds.
forestplot(
  fit_reml,
  exponentiate = TRUE,
  favours = c("Lower mortality", "Higher mortality")
)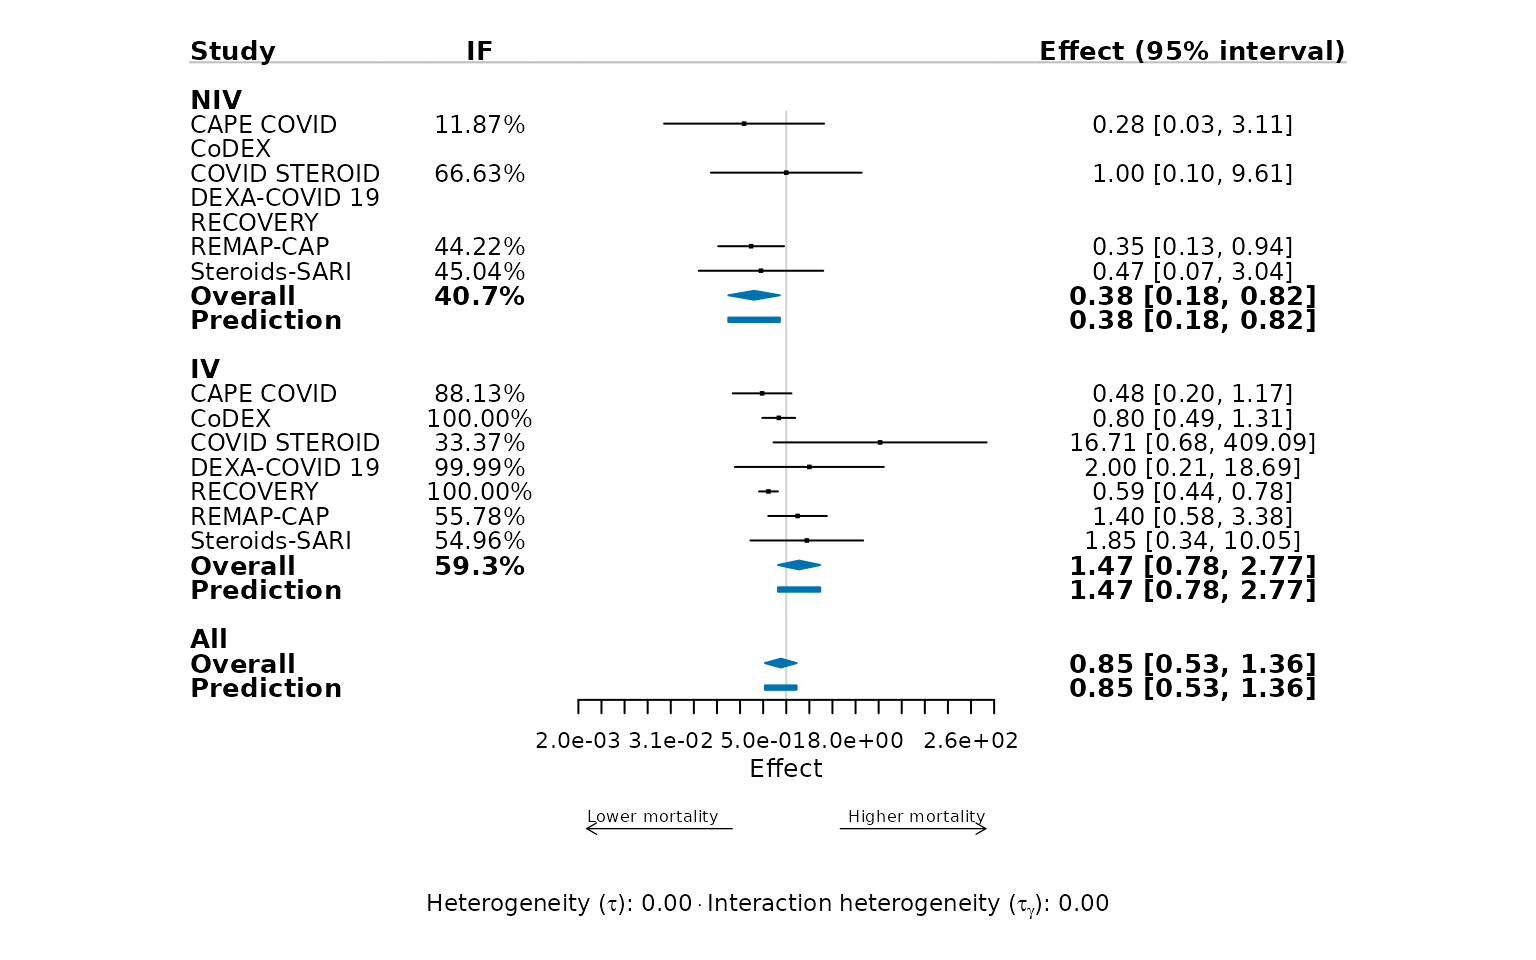
Caption ingredients: population (critically ill
COVID-19), estimand (OR for mortality by ventilation subgroup),
CAMS with
method = "REML", reference
NIV, reporting IF from
ifrac(fit_reml), interval type (Wald CI
for REML).
Next steps
-
Sensitivity to other constructions:
da(),ad(), andswada()(DA and AD are distinct estimators (Panaro et al. 2026b); see also Fisher et al. (2017)), pluscompare()onsensitivity()output — worked invignette("export-and-qc"). -
Other datasets:
vignette("worked-examples").