Skip to contents

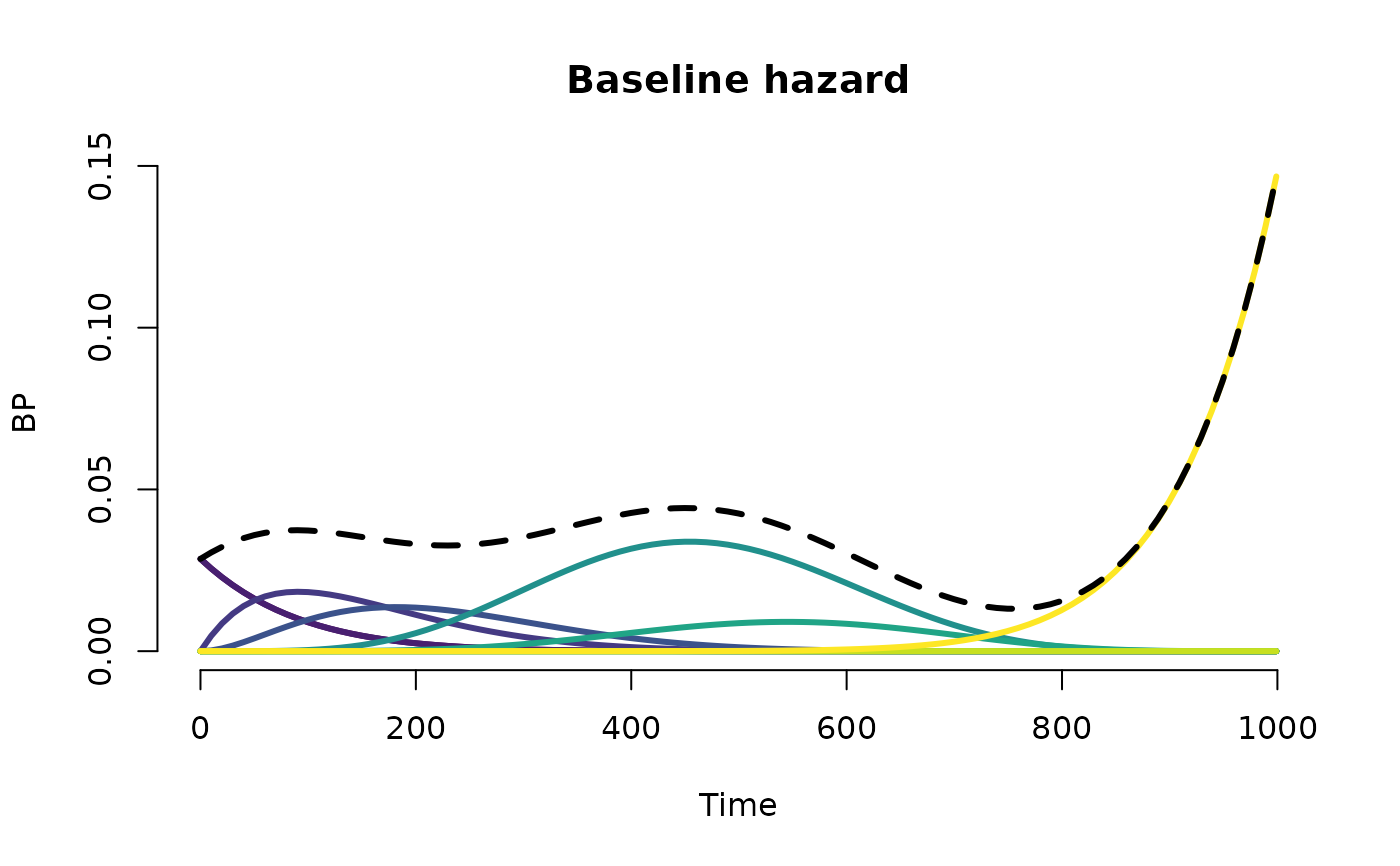
Plot for a fitted spbp model.

Usage

# S3 method for class 'spbp'
plot(
  x,
  main,
  graph = c("baseline", "basis"),
  cumulative = F,
  frame = F,
  lwd = 3,
  ...
)

Arguments

x

an object of class `spbp` result of a spbp fit.

main

graph title

graph

type of polynomial graph, default is "basis"

cumulative

TRUE for odds and cumulative hazard

frame

graphical parameter; default is FALSE

lwd

graphical parameter; default is 3

...

further arguments passed to or from other methods

See also

Examples


library("spsurv")
data("veteran", package = "survival")
#> Warning: data set ‘veteran’ not found

fit <- bpph(Surv(time, status) ~ karno + factor(celltype),
  data = veteran
)
#> Priors are ignored because the MLE approach is used.
plot(fit)